Displaying Saved Charts

The ability to load a saved chart is a nice feature, however it's important to understand that to display a saved AppGrid chart, the chart has a dependency on the selected view and selected query. If either of these values are different than what was in effect when the chart was created, it is possible that the saved chart cannot be rendered.
When creating a chart, you first make a cell selection that contains the grid data you want the chart to display and then right-click to select the chart type and other configuration properties. When the chart is saved, there are 5 properties that are saved as part of the chart definition and effect how the chart will display:
row start index
row end index
columns
selected view
selected query
The chart will always use the current grid data as the basis for generating the chart. It then uses the row index and column properties to create the chart data. Another way of saying this is the saved chart has a runtime dependency on the selected query (from which the chart data is retrieved) and also the selected view, as this contains the columns from which the chart is displaying.
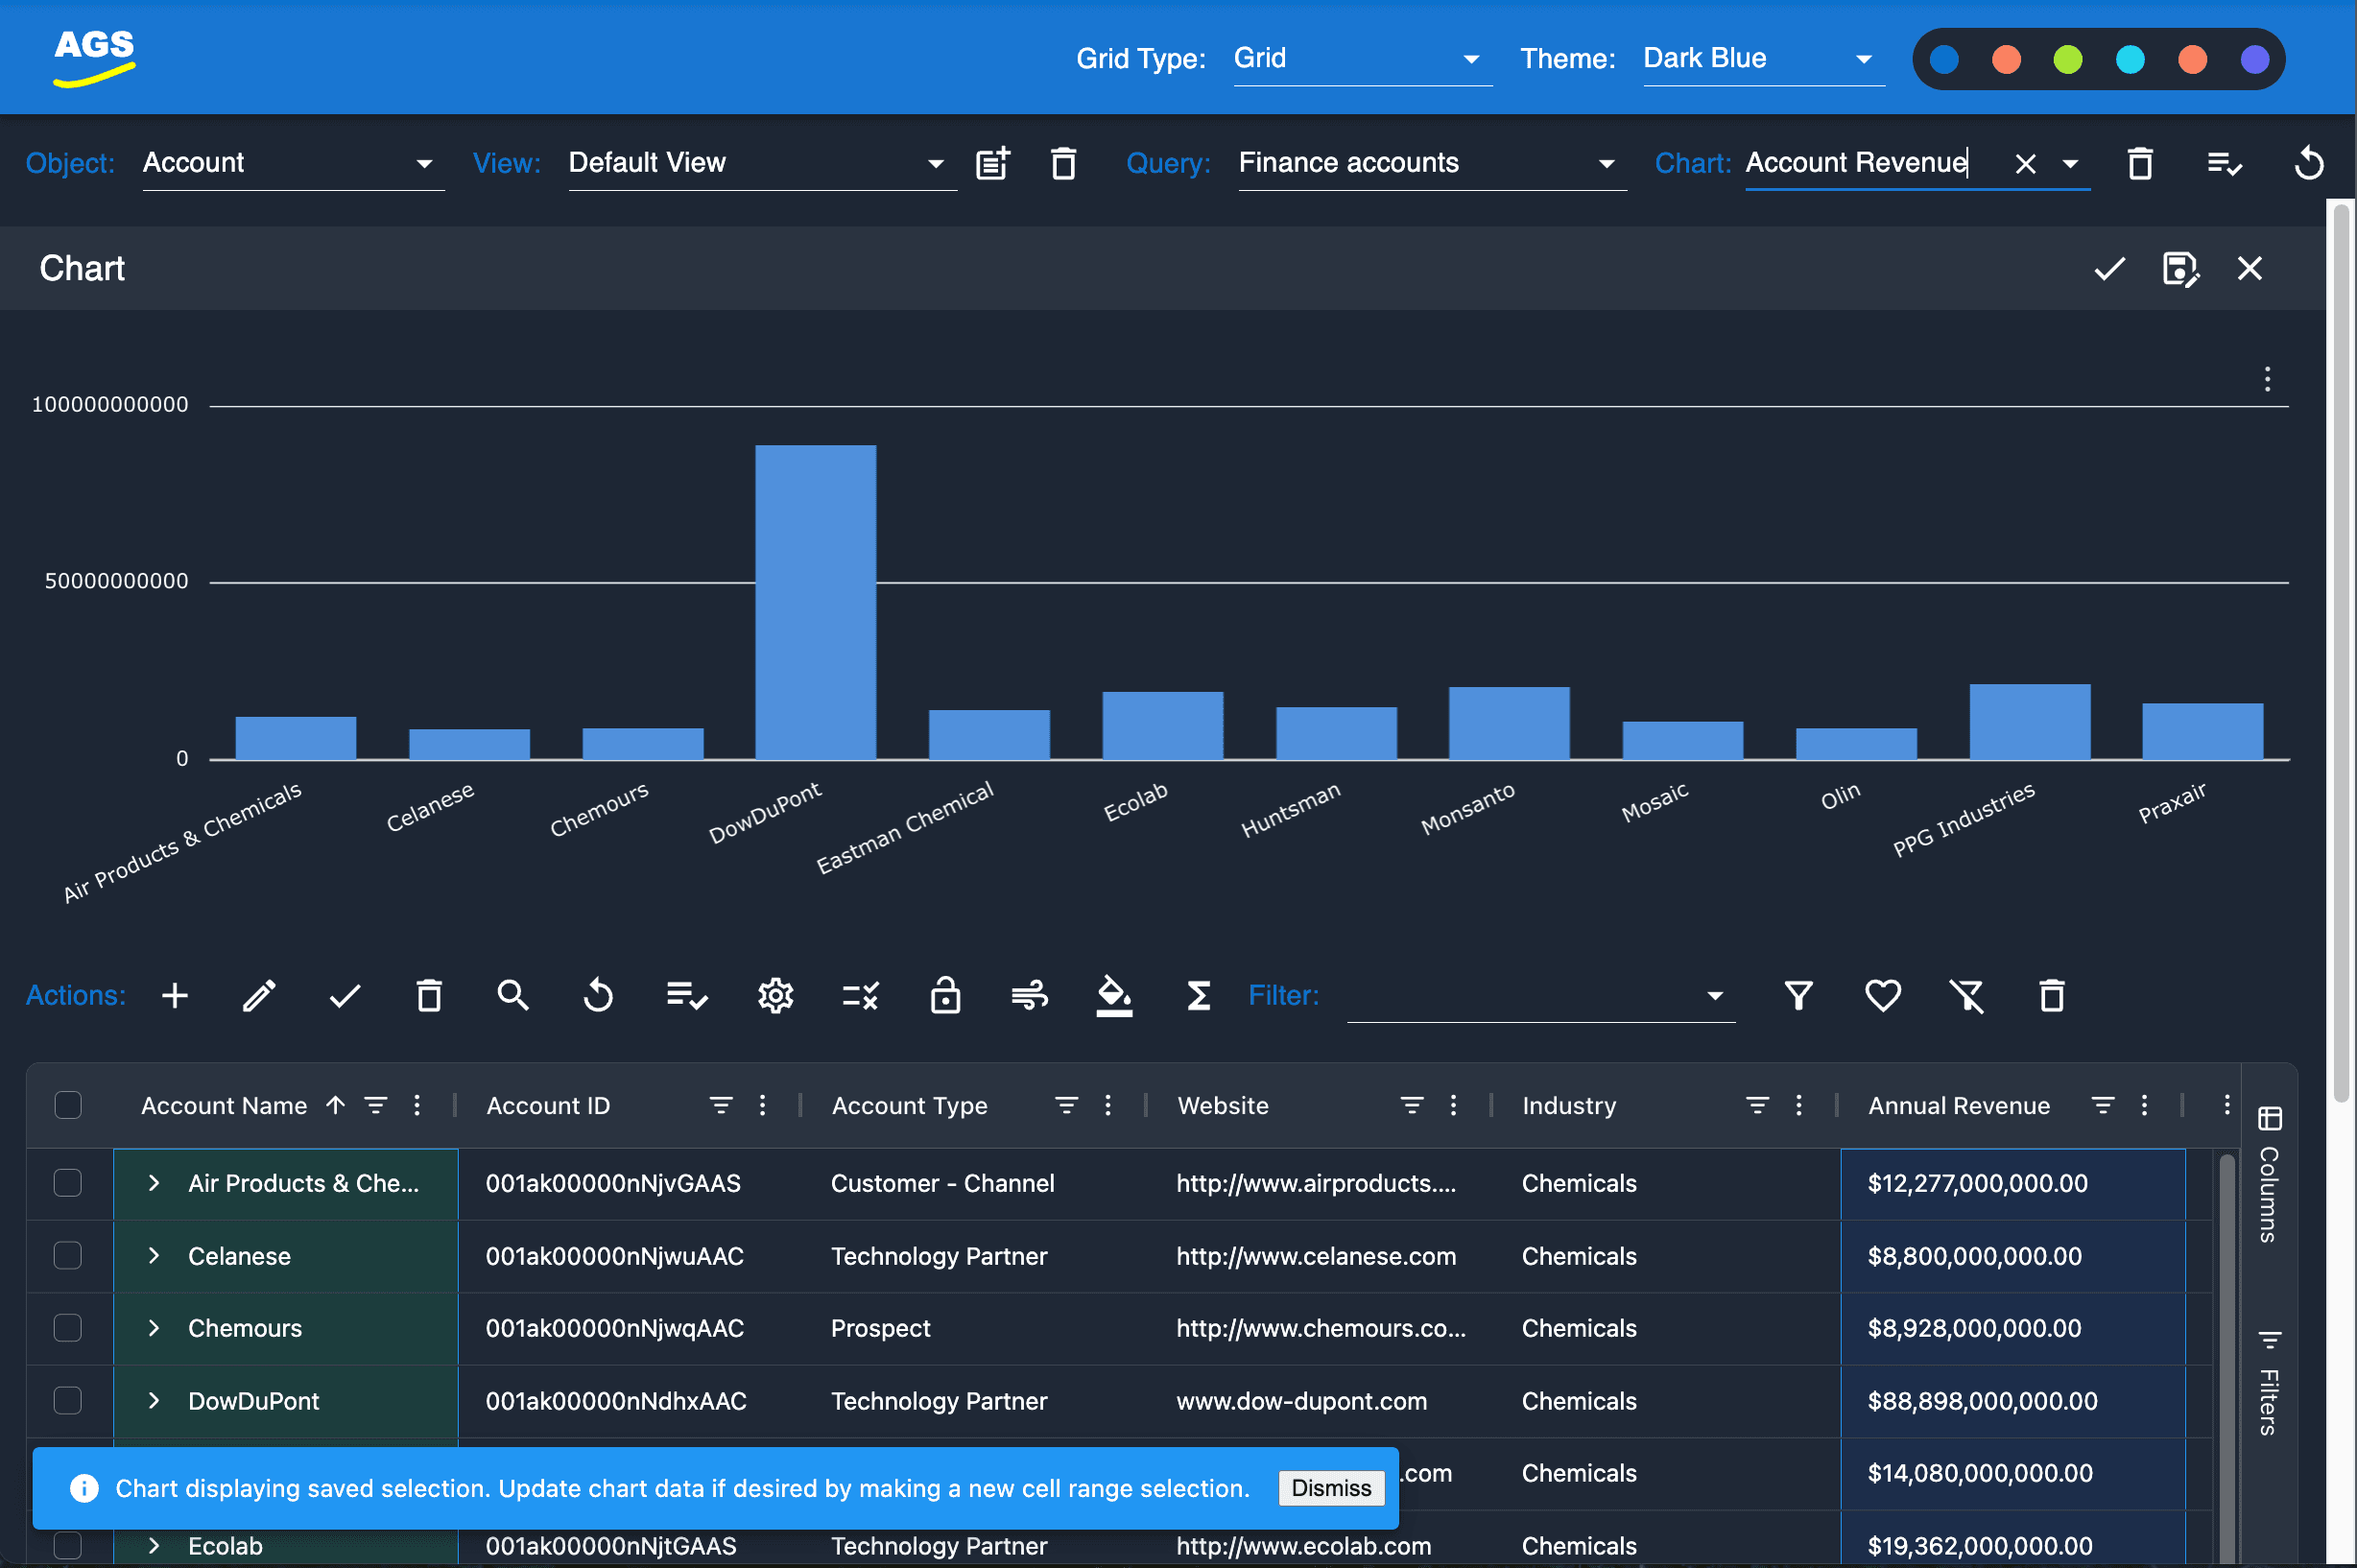
If we load a saved chart, and the current query matches the query that was in effect when the chart was created, AppGrid will display a notification that the chart is displaying a saved selection. This is a reminder that to update the chart, a new selection may be required.
If we load a saved chart, and the current query does not match the query that was in effect when the chart was created, AppGrid will display a notification that the chart was created with a different query. It is possible, that a different query will result in no chart being displayed. The user can simply select the query from the query selector, which will reload the grid data and update the chart.
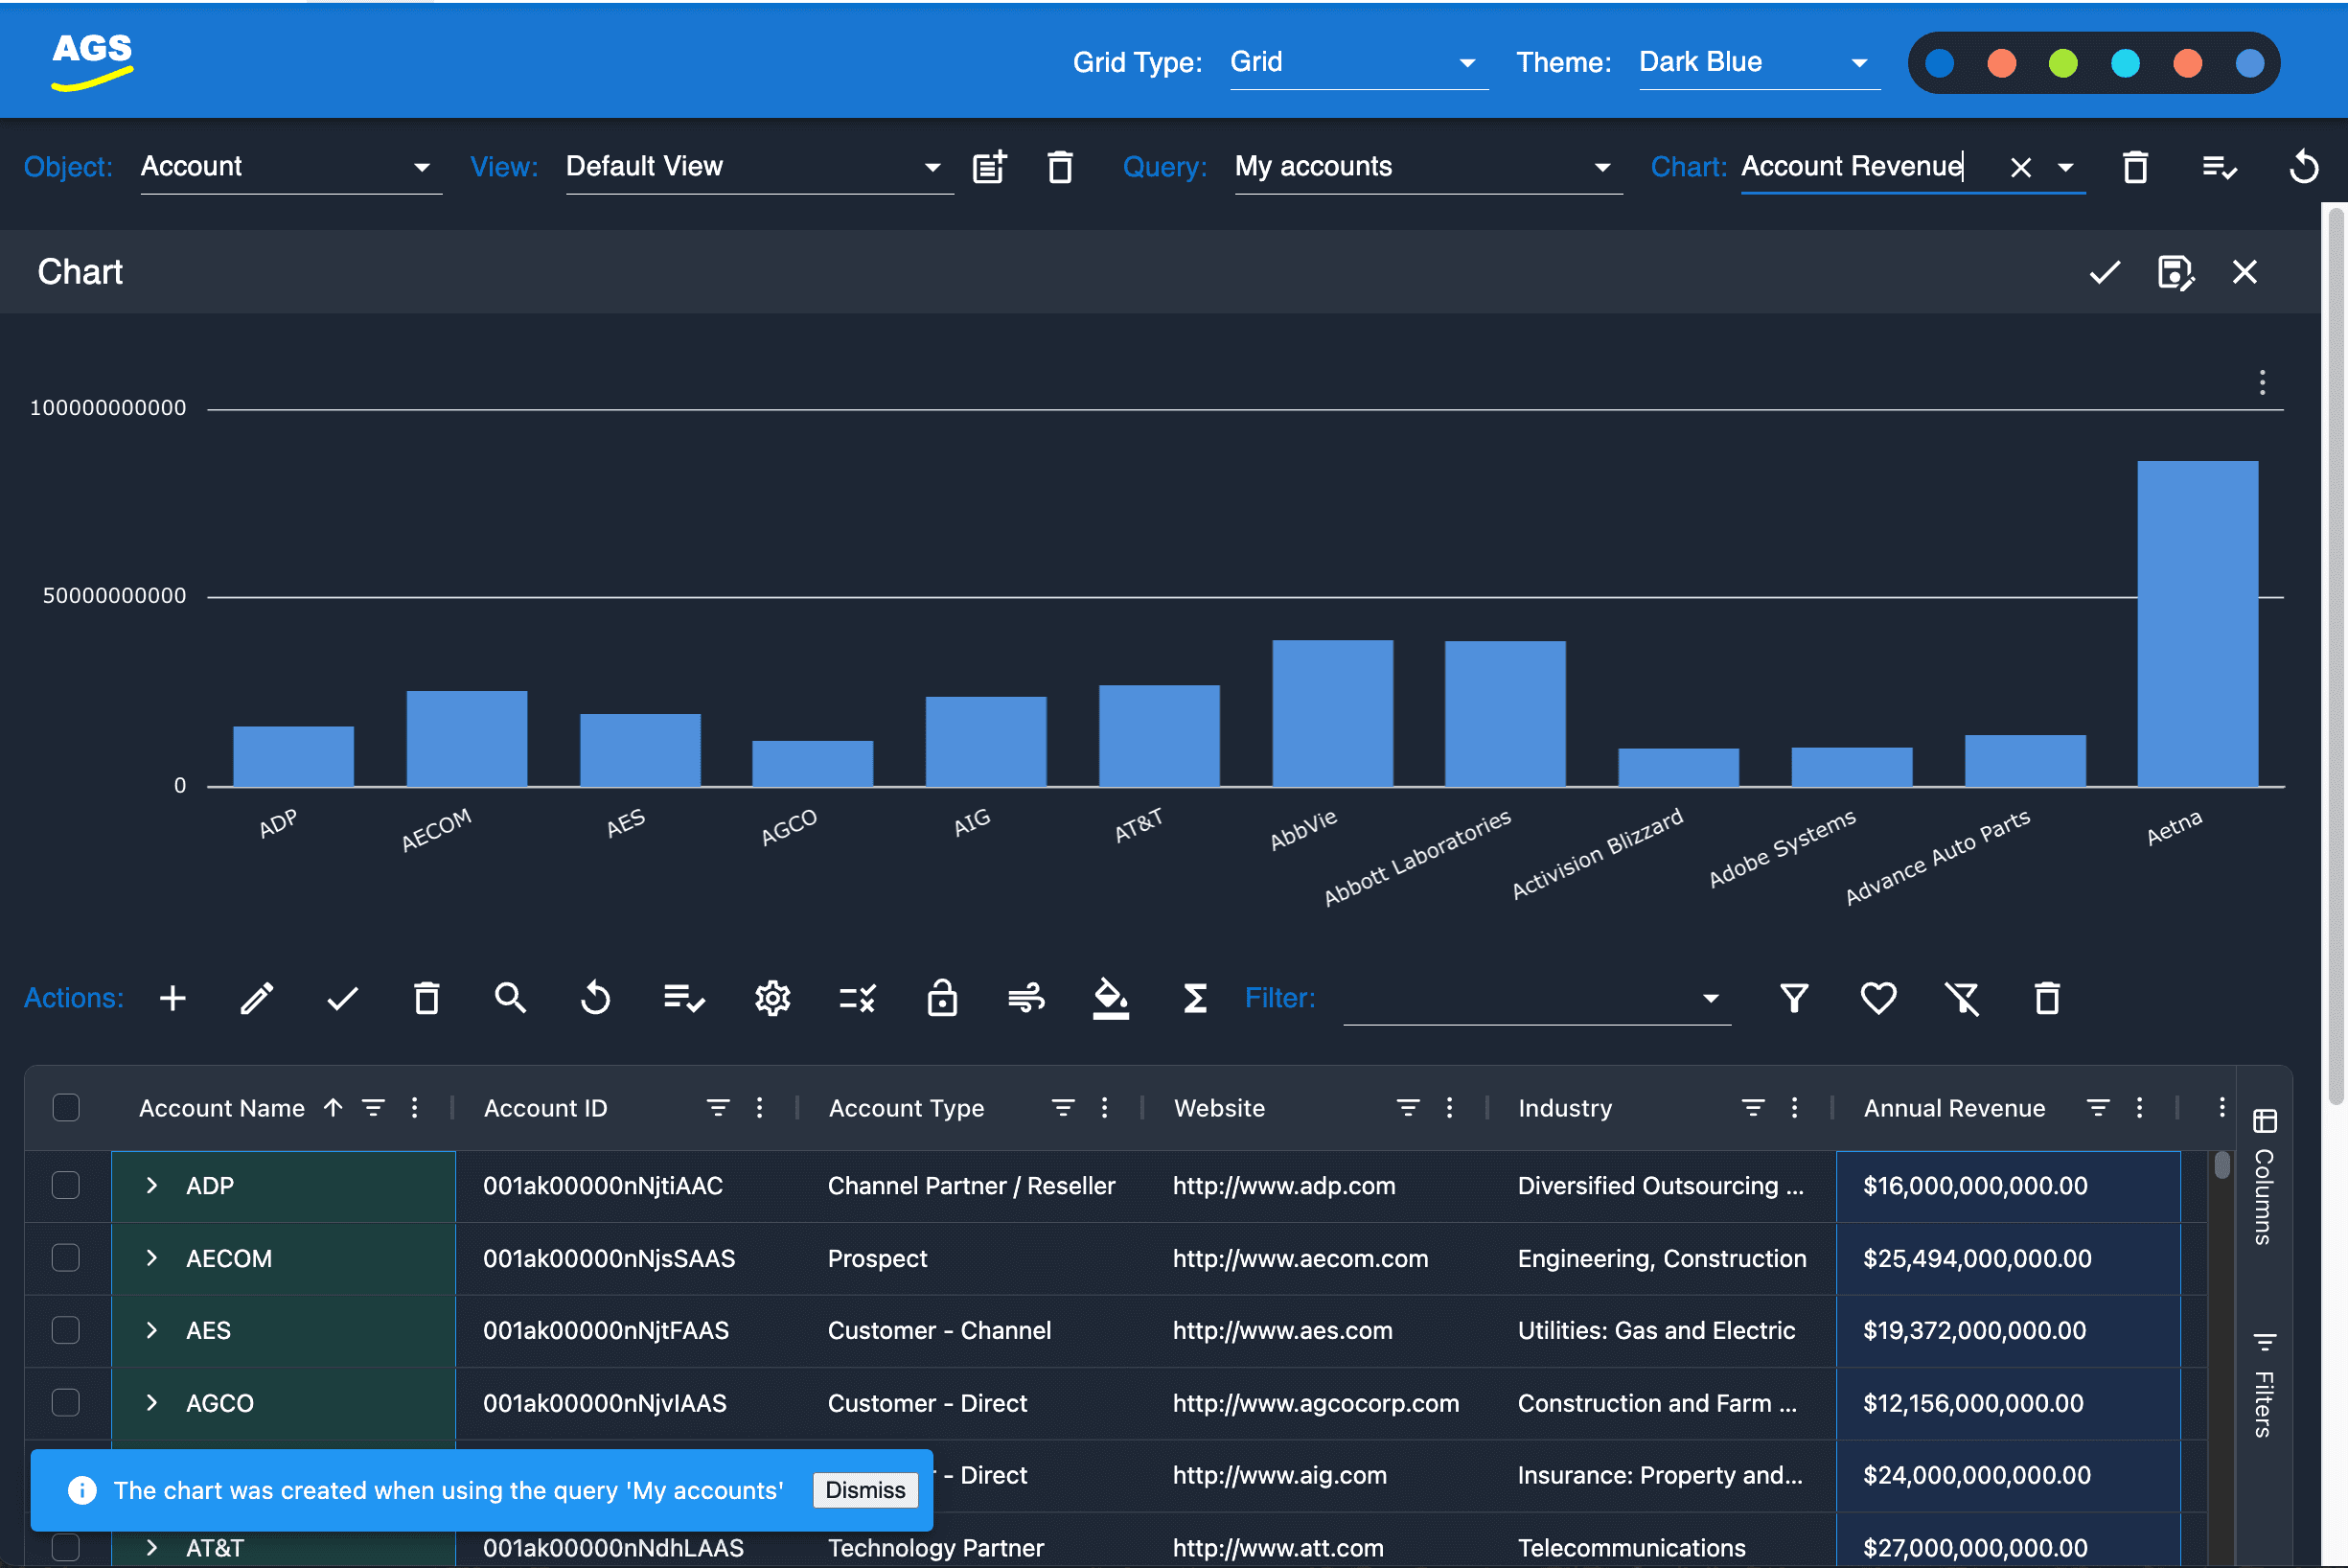
Neither of these messages indicate an error, but rather information to the user about the source of data used to create the chart.
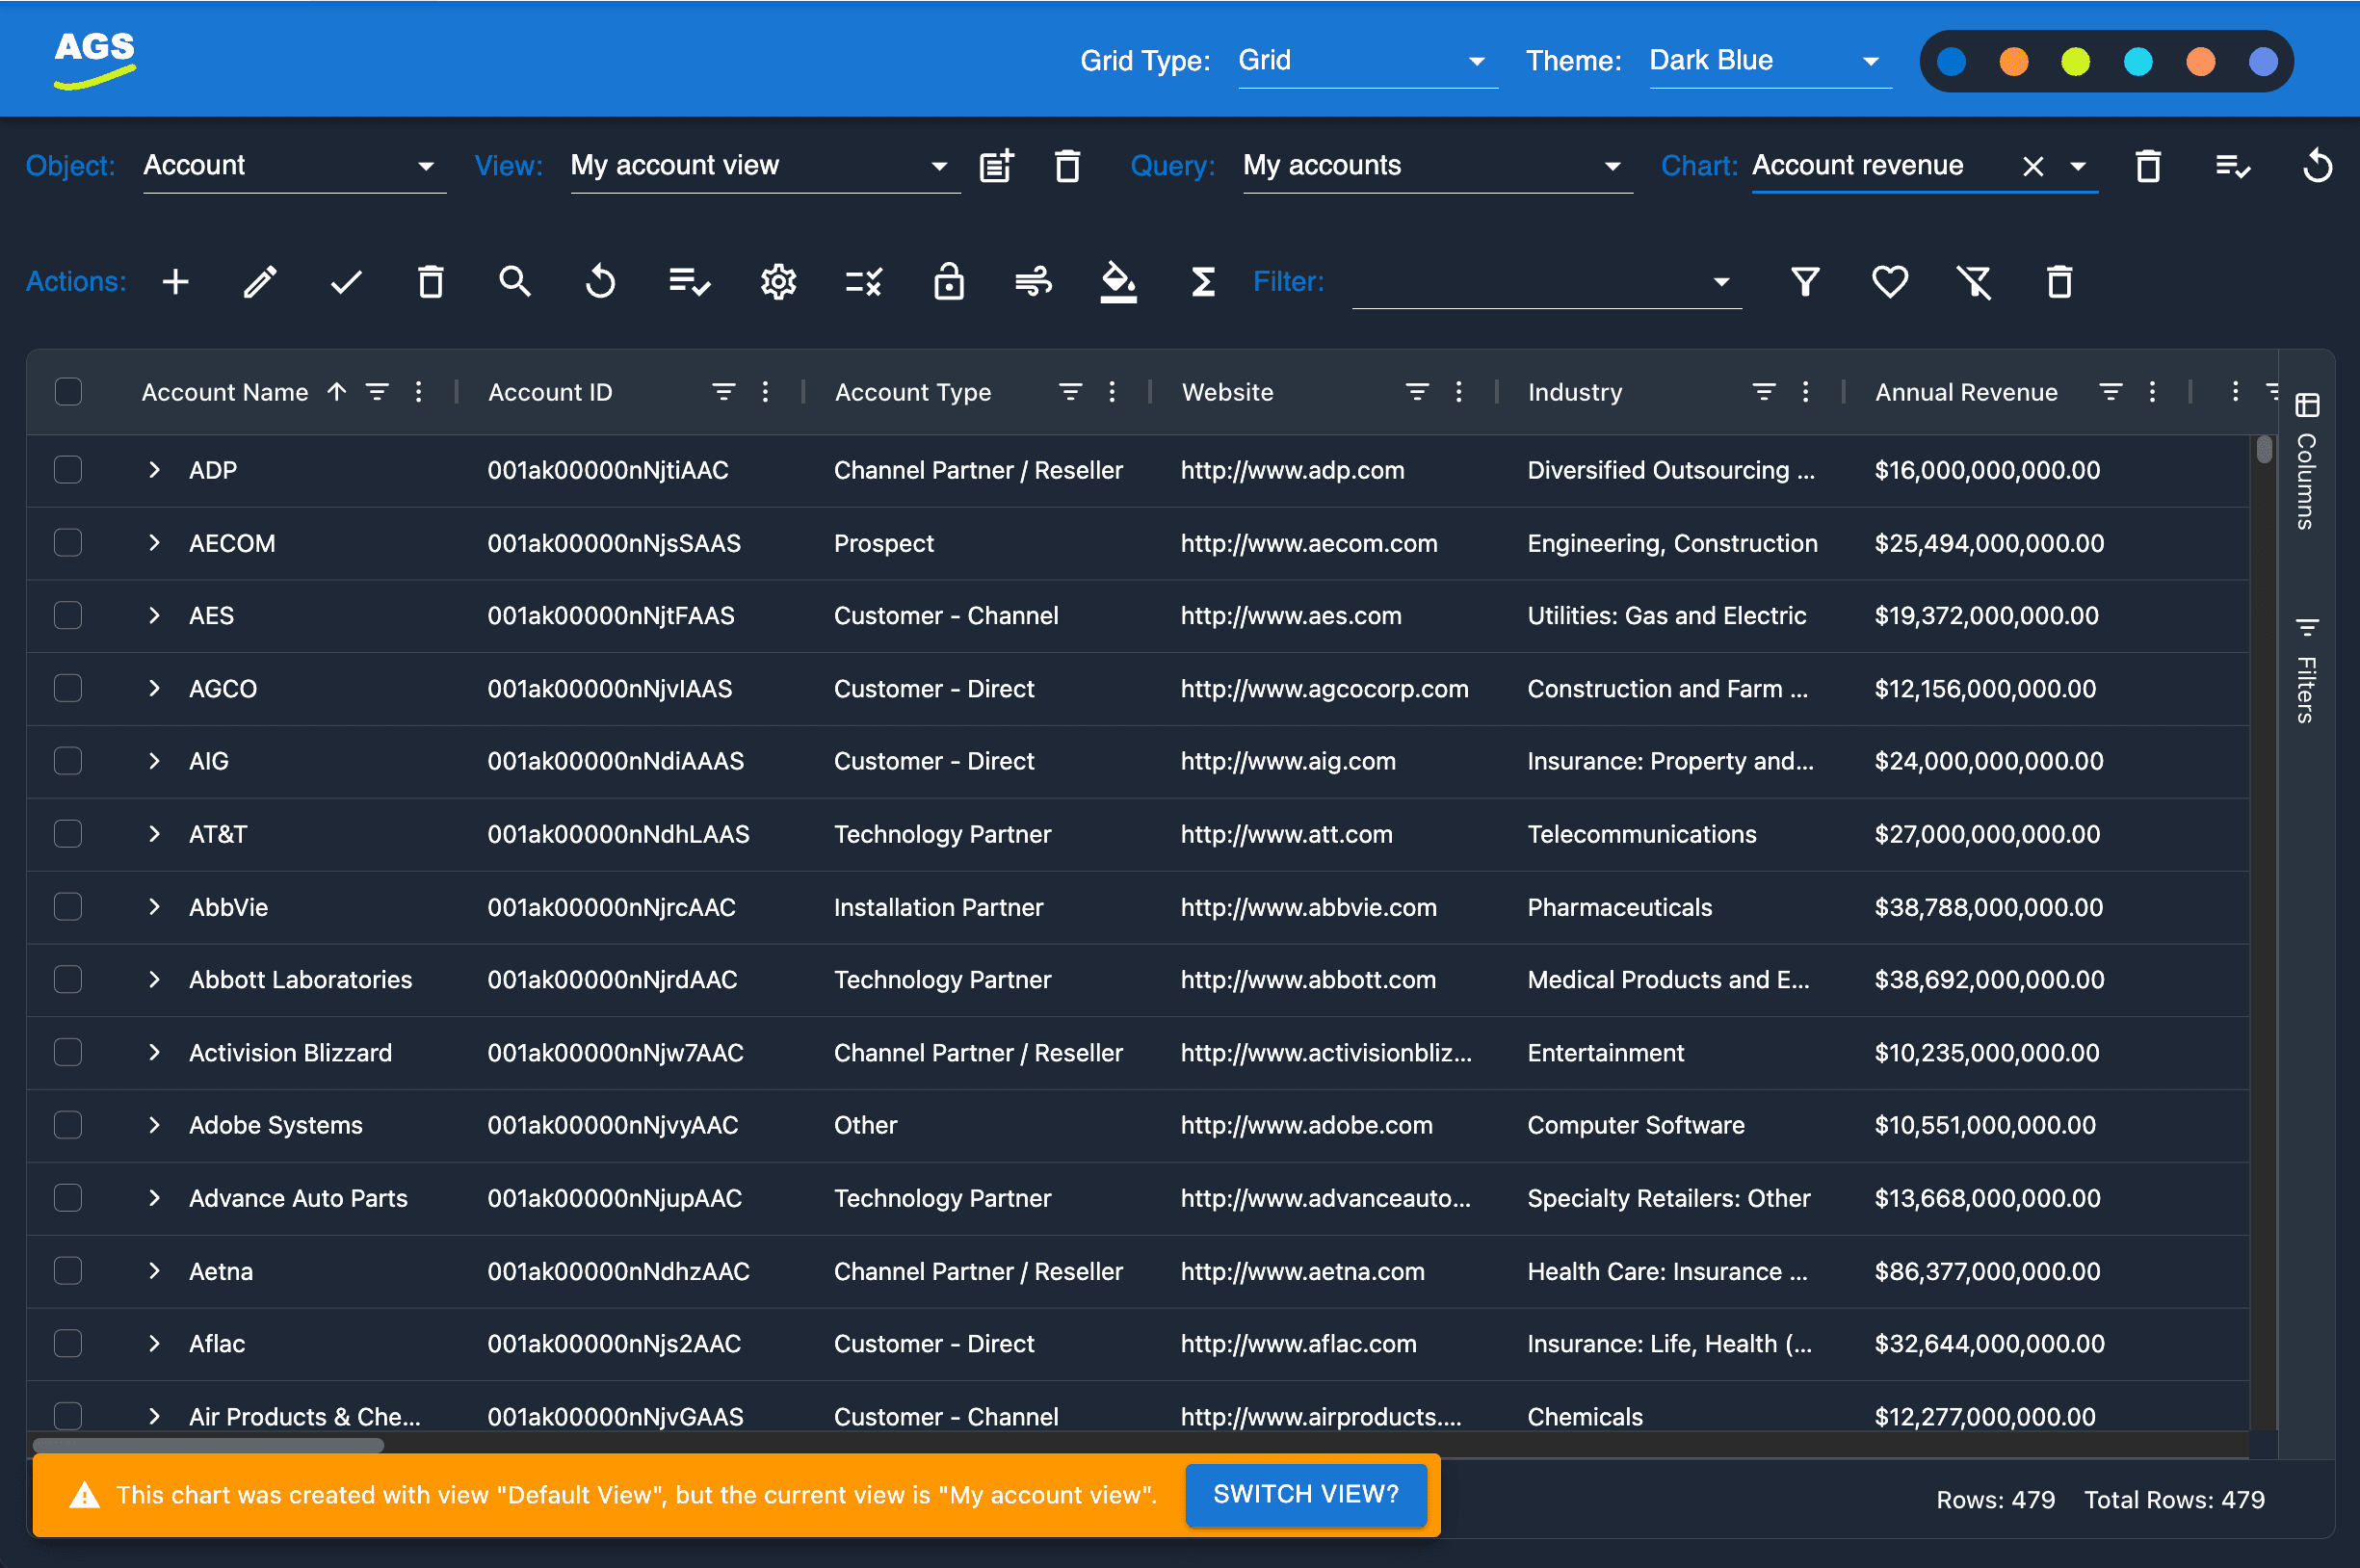
AppGrid will also check that the selected view matches the view which was active when the chart was created. If the selected view does not match the chart view property, a warning message will be displayed along with a button to switch to the saved chart view. It's possible that the current view columns do not match the saved chart columns property which if that's the case, the chart will not be able to be displayed wthout changing the view.