AppGrid: Time Series View
Powerful query, filtering, personalization, and presentation features
that delight users, maximize productivity and increase user adoption
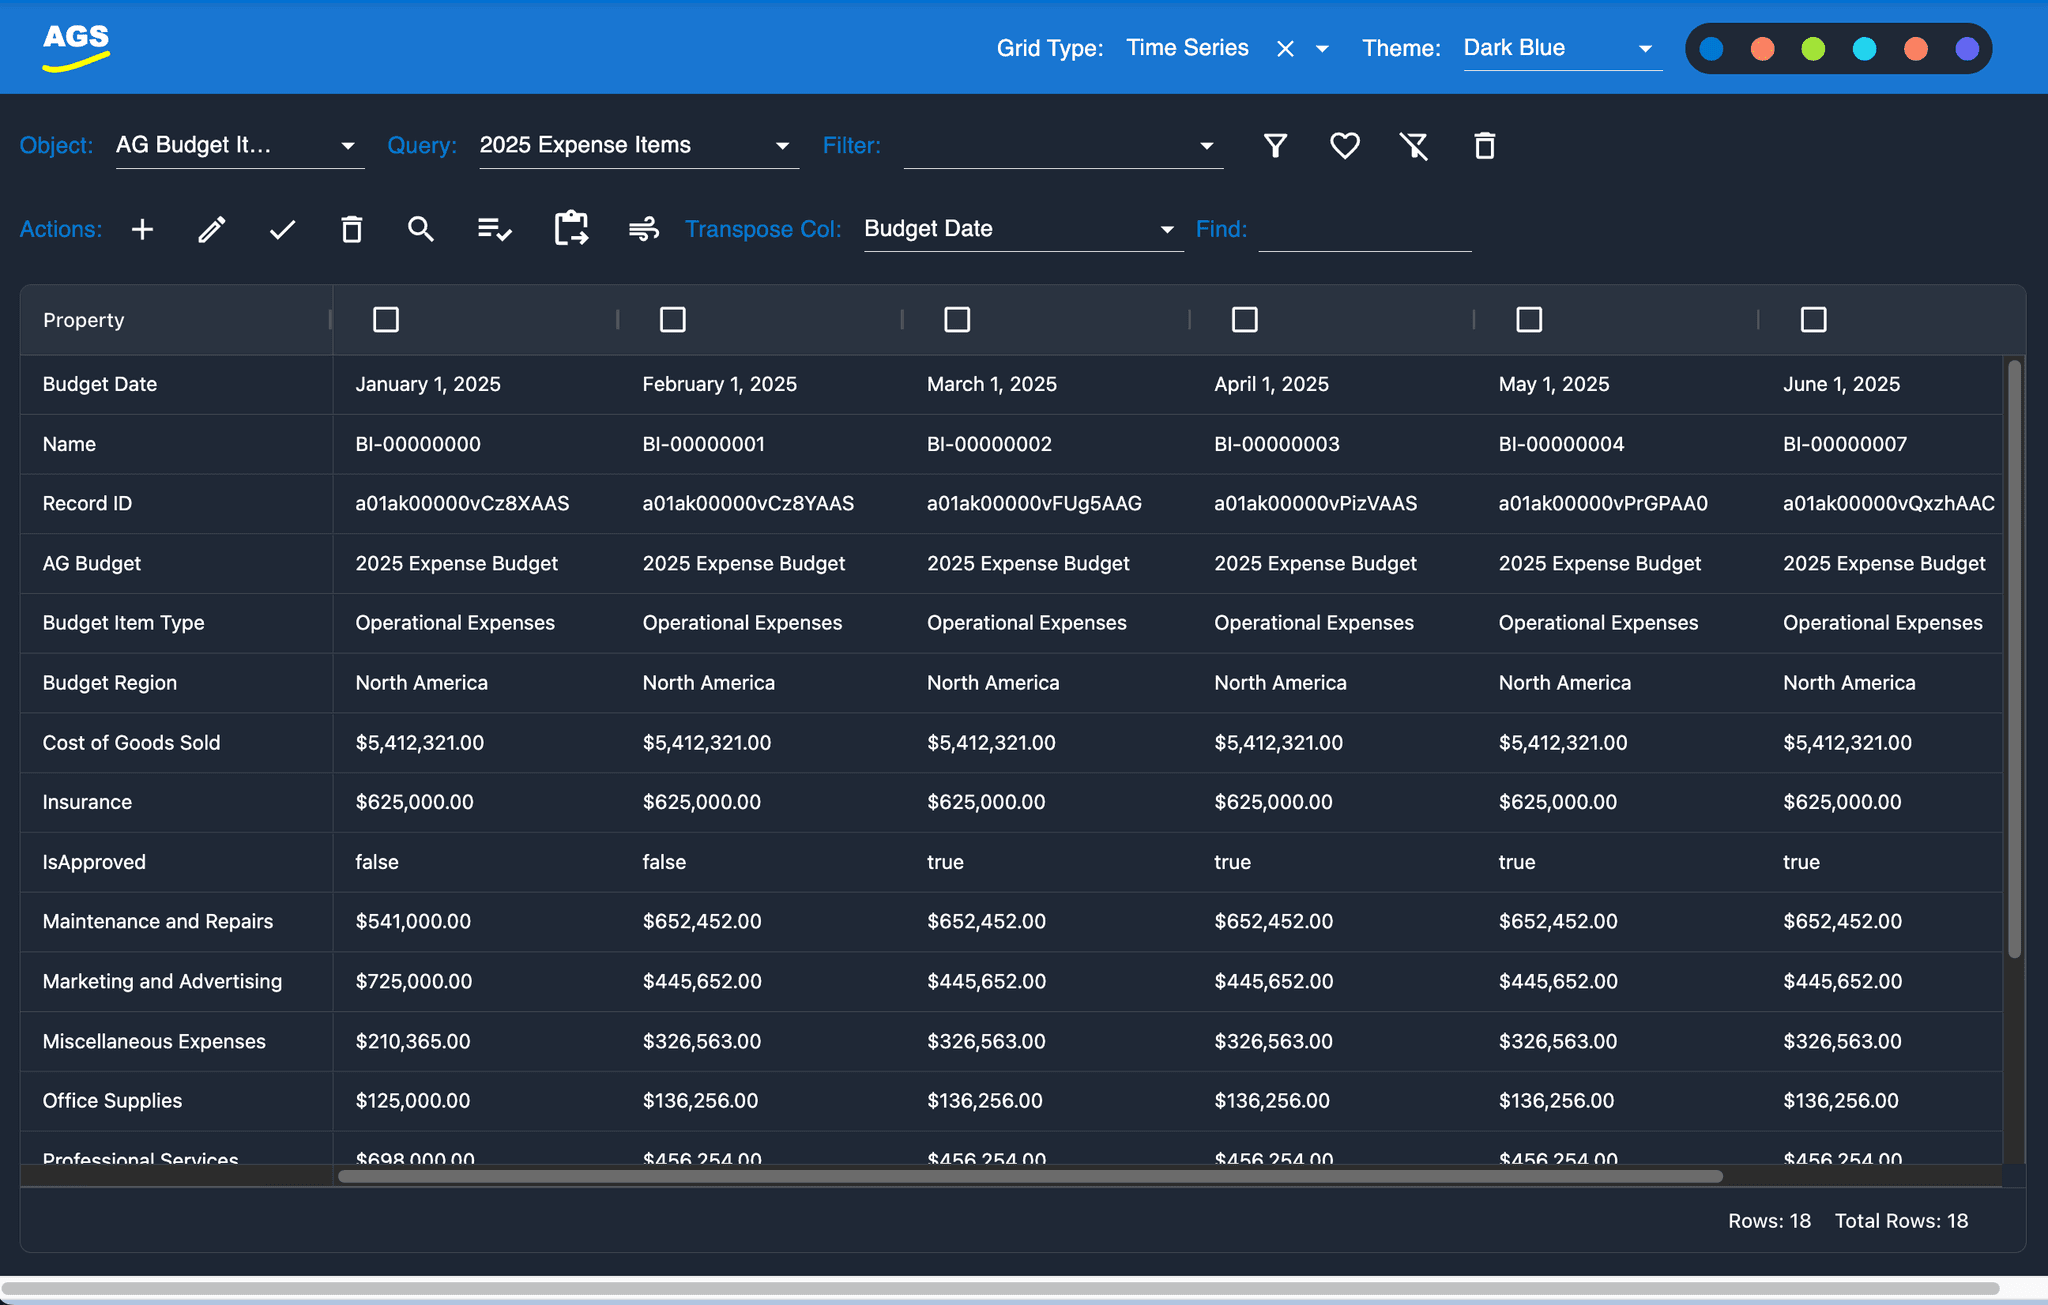
The AppGrid time series view makes creating time-series data like budgets or forecasts fast, easy and intuitive. Users typically create this type of data in Excel where the records are displayed in columns and the attributes displayed in rows, and that is also how the AppGrid time series view works. One reason for this is that it is very useful to see how specific values change as a function of time.
The other challenge is related to record creation. With a list view, it is very unintuitive and labor intensive to create time series records one by one, as you have no context as to how that record relates to other records. For example, a given budget item value may vary by month as a function of time.
And lastly, what we really want to do is create the entire budget or forecast in a single transaction just like what we would do in Excel. The good news is that the AppGrid time series view provides these capabilities.
The AppGrid time series view makes creating time-series data like budgets or forecasts easy, fast and intuitive. Users typically create this type of data in Excel where the records are displayed in columns and the attributes displayed in rows, and that is also how the AppGrid time series view works. One reason for this is that it is very useful to see how specific values change as a function of time. The other challenge is related to record creation.
With a list view, it is very unintuitive to create records one by one, as you have no context as to how that record relates to other records. And lastly, what we really want to do is create the entire budget or forecast in a single transaction just like what we would do in Excel. The good news is that the AppGrid time series view provides these capabilities.
Time Series View
Time Series Overview
In the image below, we have a budget object defined that will represent the various types of budgets we can create. Note, this object will be included in the AppGrid package, or you can create your own object if desired. In either case, create whatever fields are required to support your budget process.
In the above image, we have a budget item child object defined that will represent the budget item records. Note, this object will be included in the AppGrid package, or you can create your own object if desired. In either case, create whatever fields are required to support your budget process.

In the image below, we have a budget item object defined that will represent the budget item records we can create. Note, this object will be included in the AppGrid package, or you can create your own object if desired. In either case, create whatever fields are required to support your budget process.
CONFIGURING THE TIME SERIES VIEW
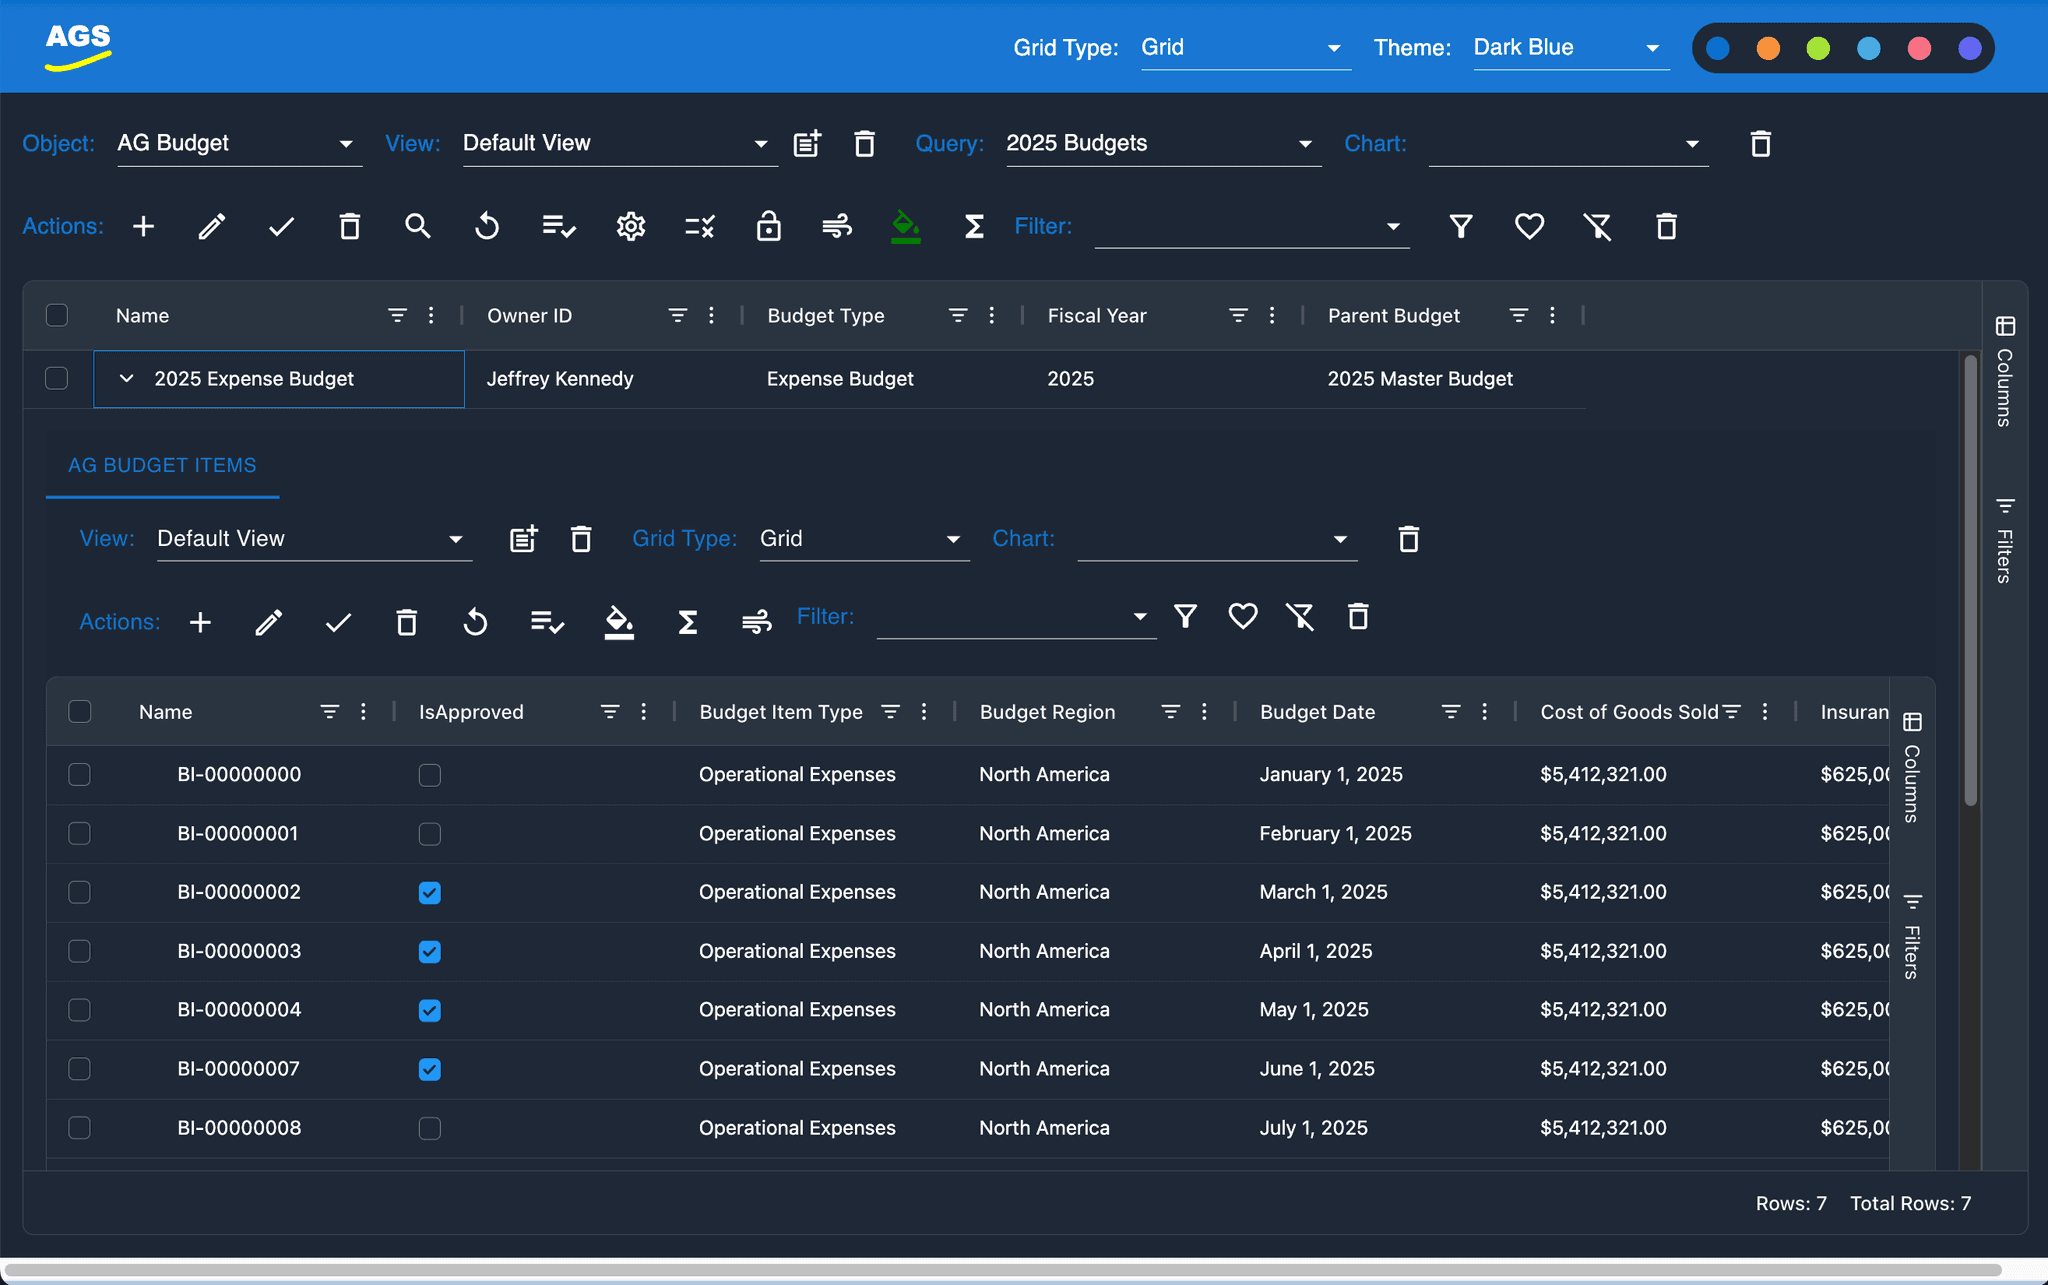
The AppGrid time series view depends upon the AppGrid grid view for it's configuration. The order of the time series view records will be determined from the selected AppGrid grid view. Let's look at an example. In the image below, we are viewing budget item records in the grid view. Notice the order of the columns in the selected view named 'Default View', and the order of the records.

Now let's look at this same data in the time series view. Notice that the order of the records matches the order of the columns in the grid view. Notice that the order of the time series columns will be the same as the order of the grid view recorrds.

CREATING TIME SERIES DATA
TIME SERIES VIEW INTRODUCTION
AppGrid provides a quick and easy way to transfer existing budgets or forecasts created in Excel. Simply copy the Excel data and paste it into the time series view. Let's look at an example of how to copy the data:
AppGrid provides a quick and easy way to transfer existing budgets or forecasts created in Excel. Typically, we have a parent object which defines the attributes of the budget or forecast, and a child object that contains the budget or forecast item records. Let's look at an example: