AppGrid Dashboards

We are thrilled to announce the newest feature to ApπGrid - the ability to create cross-filter dashboards! While there is a place for enterprise analytics software, it comes at a steep financial cost and are complex to implement. Think architects creating data cubes and scheduled reports.
AppGrid dashboards are designed with a point-and-click interface that makes it easy for business users to create analytic reports.
We integrated AppGrid dashboards with our enterprise query technology so you can create the report once and execute different queries to change the report data dynamically.
Here is an example of a sales dashboard. Of course, we have it displayed in our favorite dark mode style.
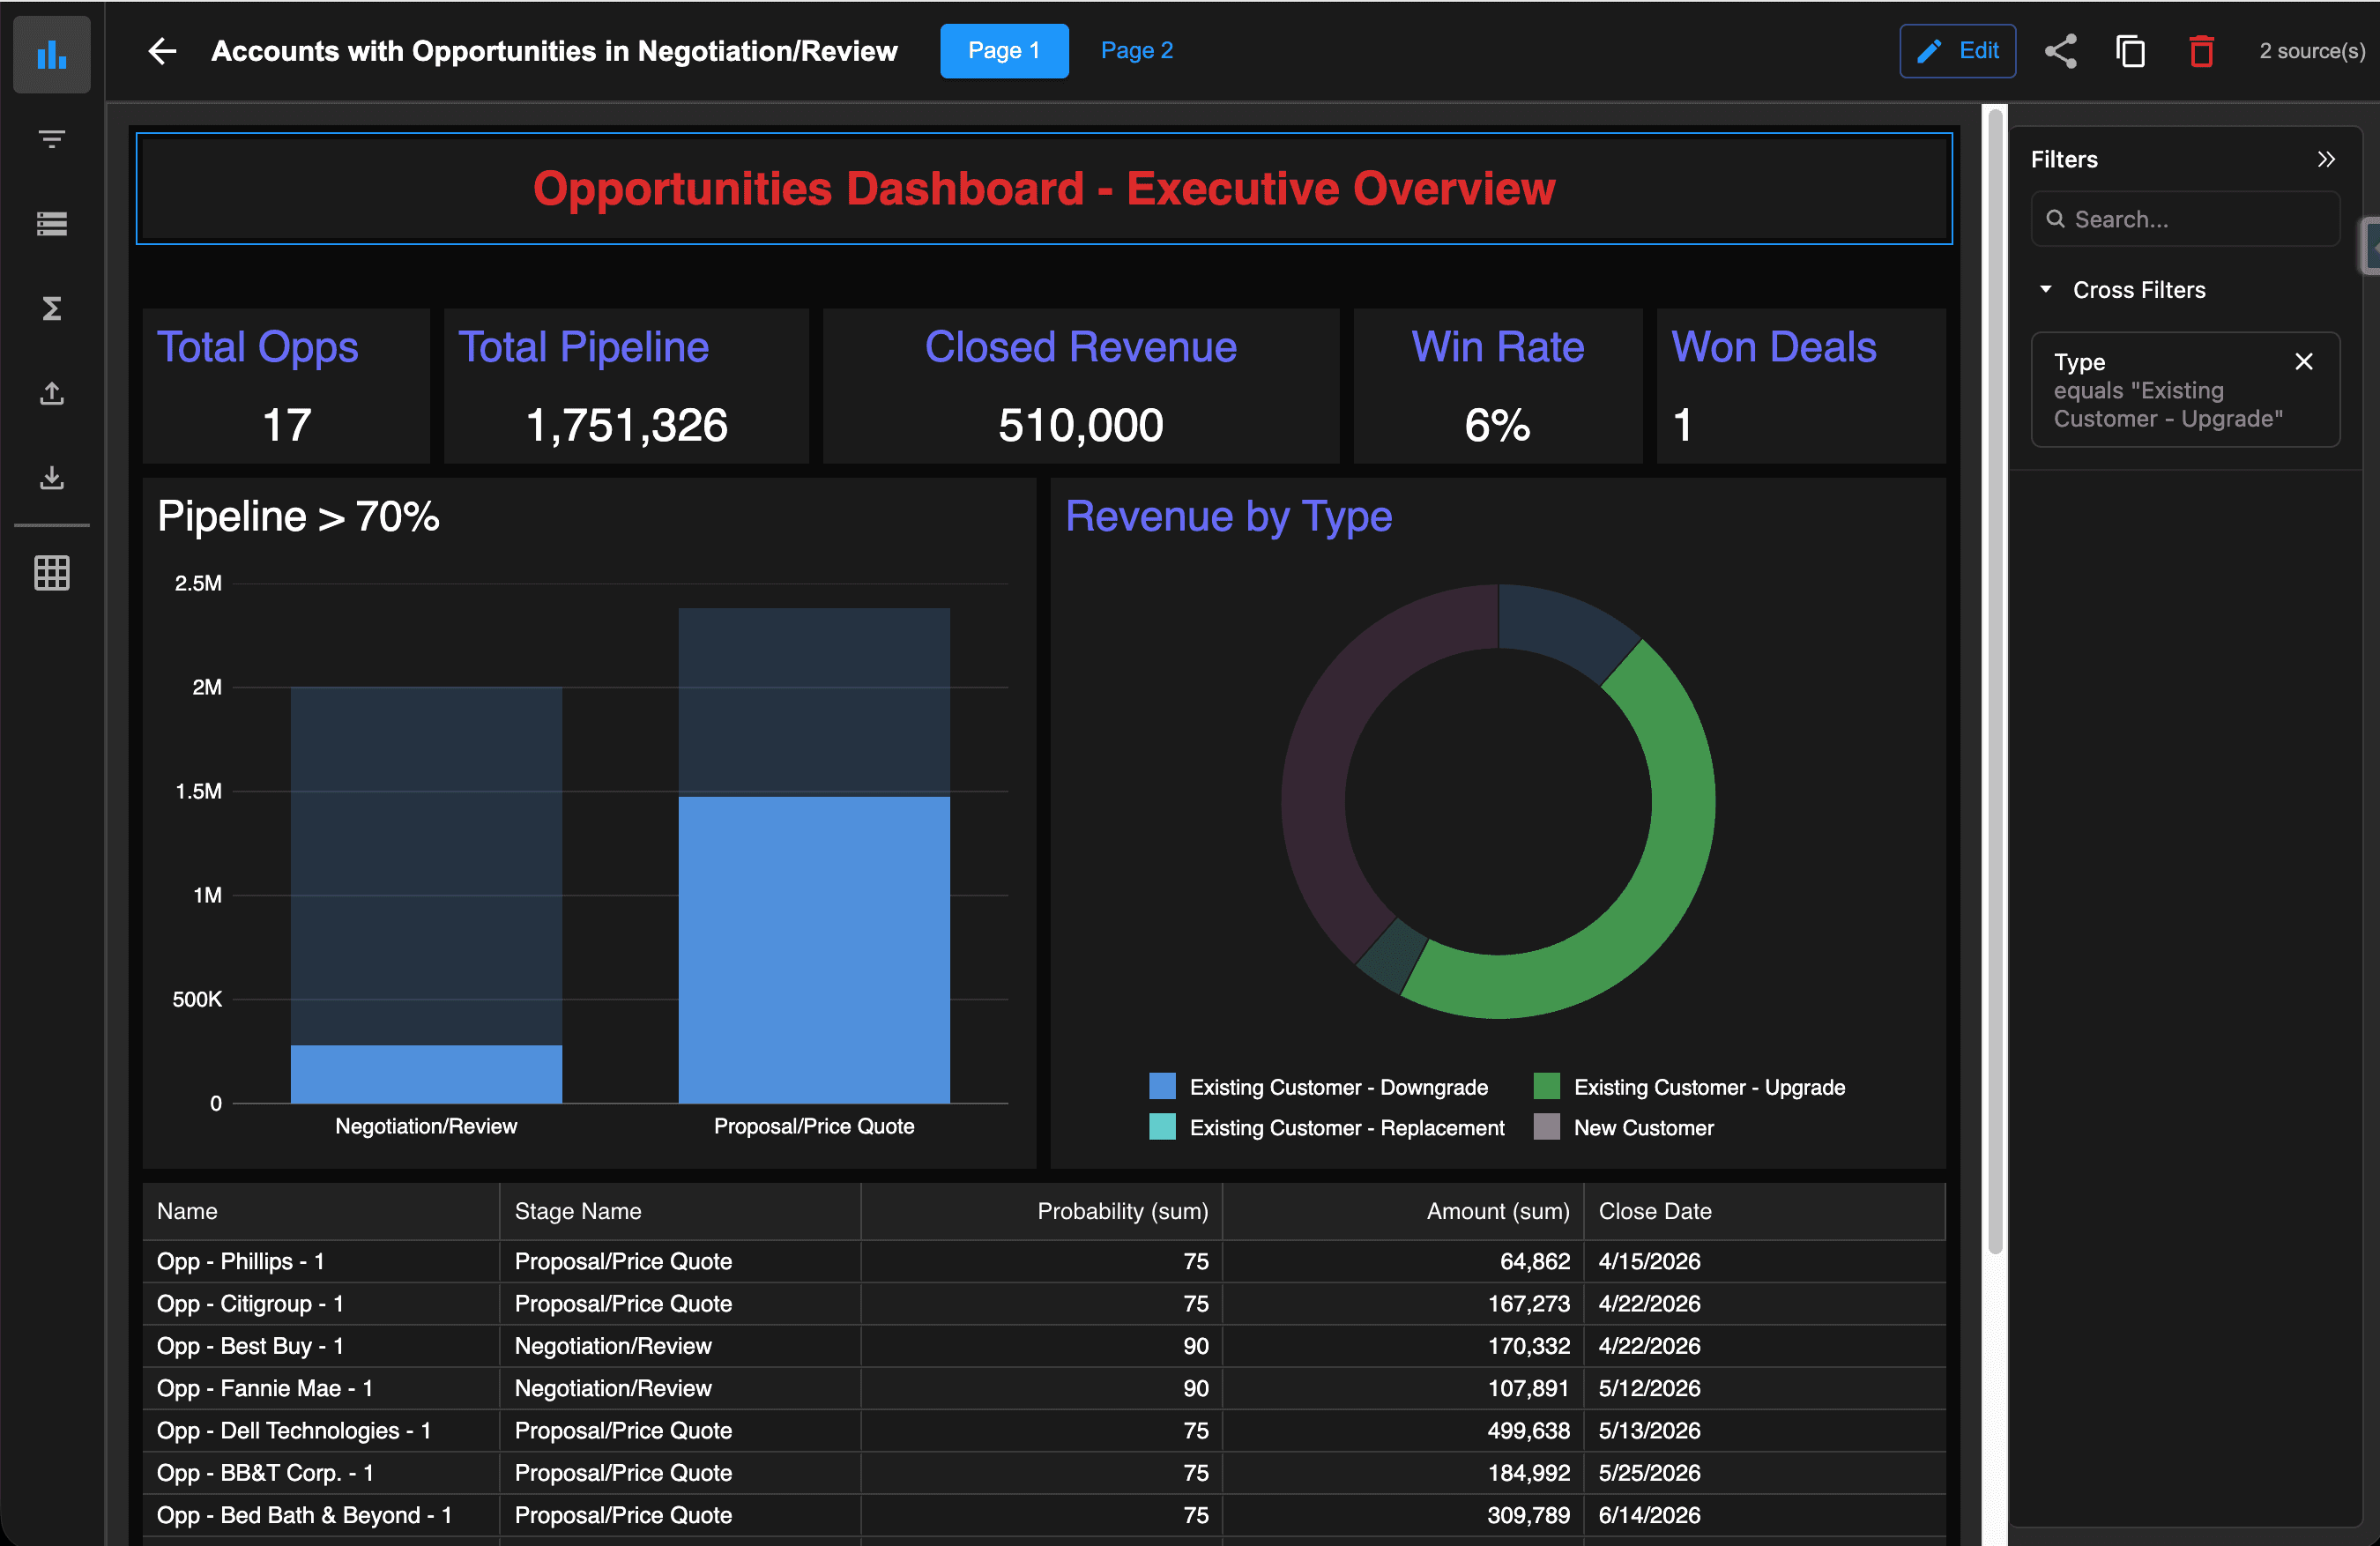
You can click on a chart bar or pie segment and the chart will update dynamically due the cross–filtering capability of AppGrid Dashboards.
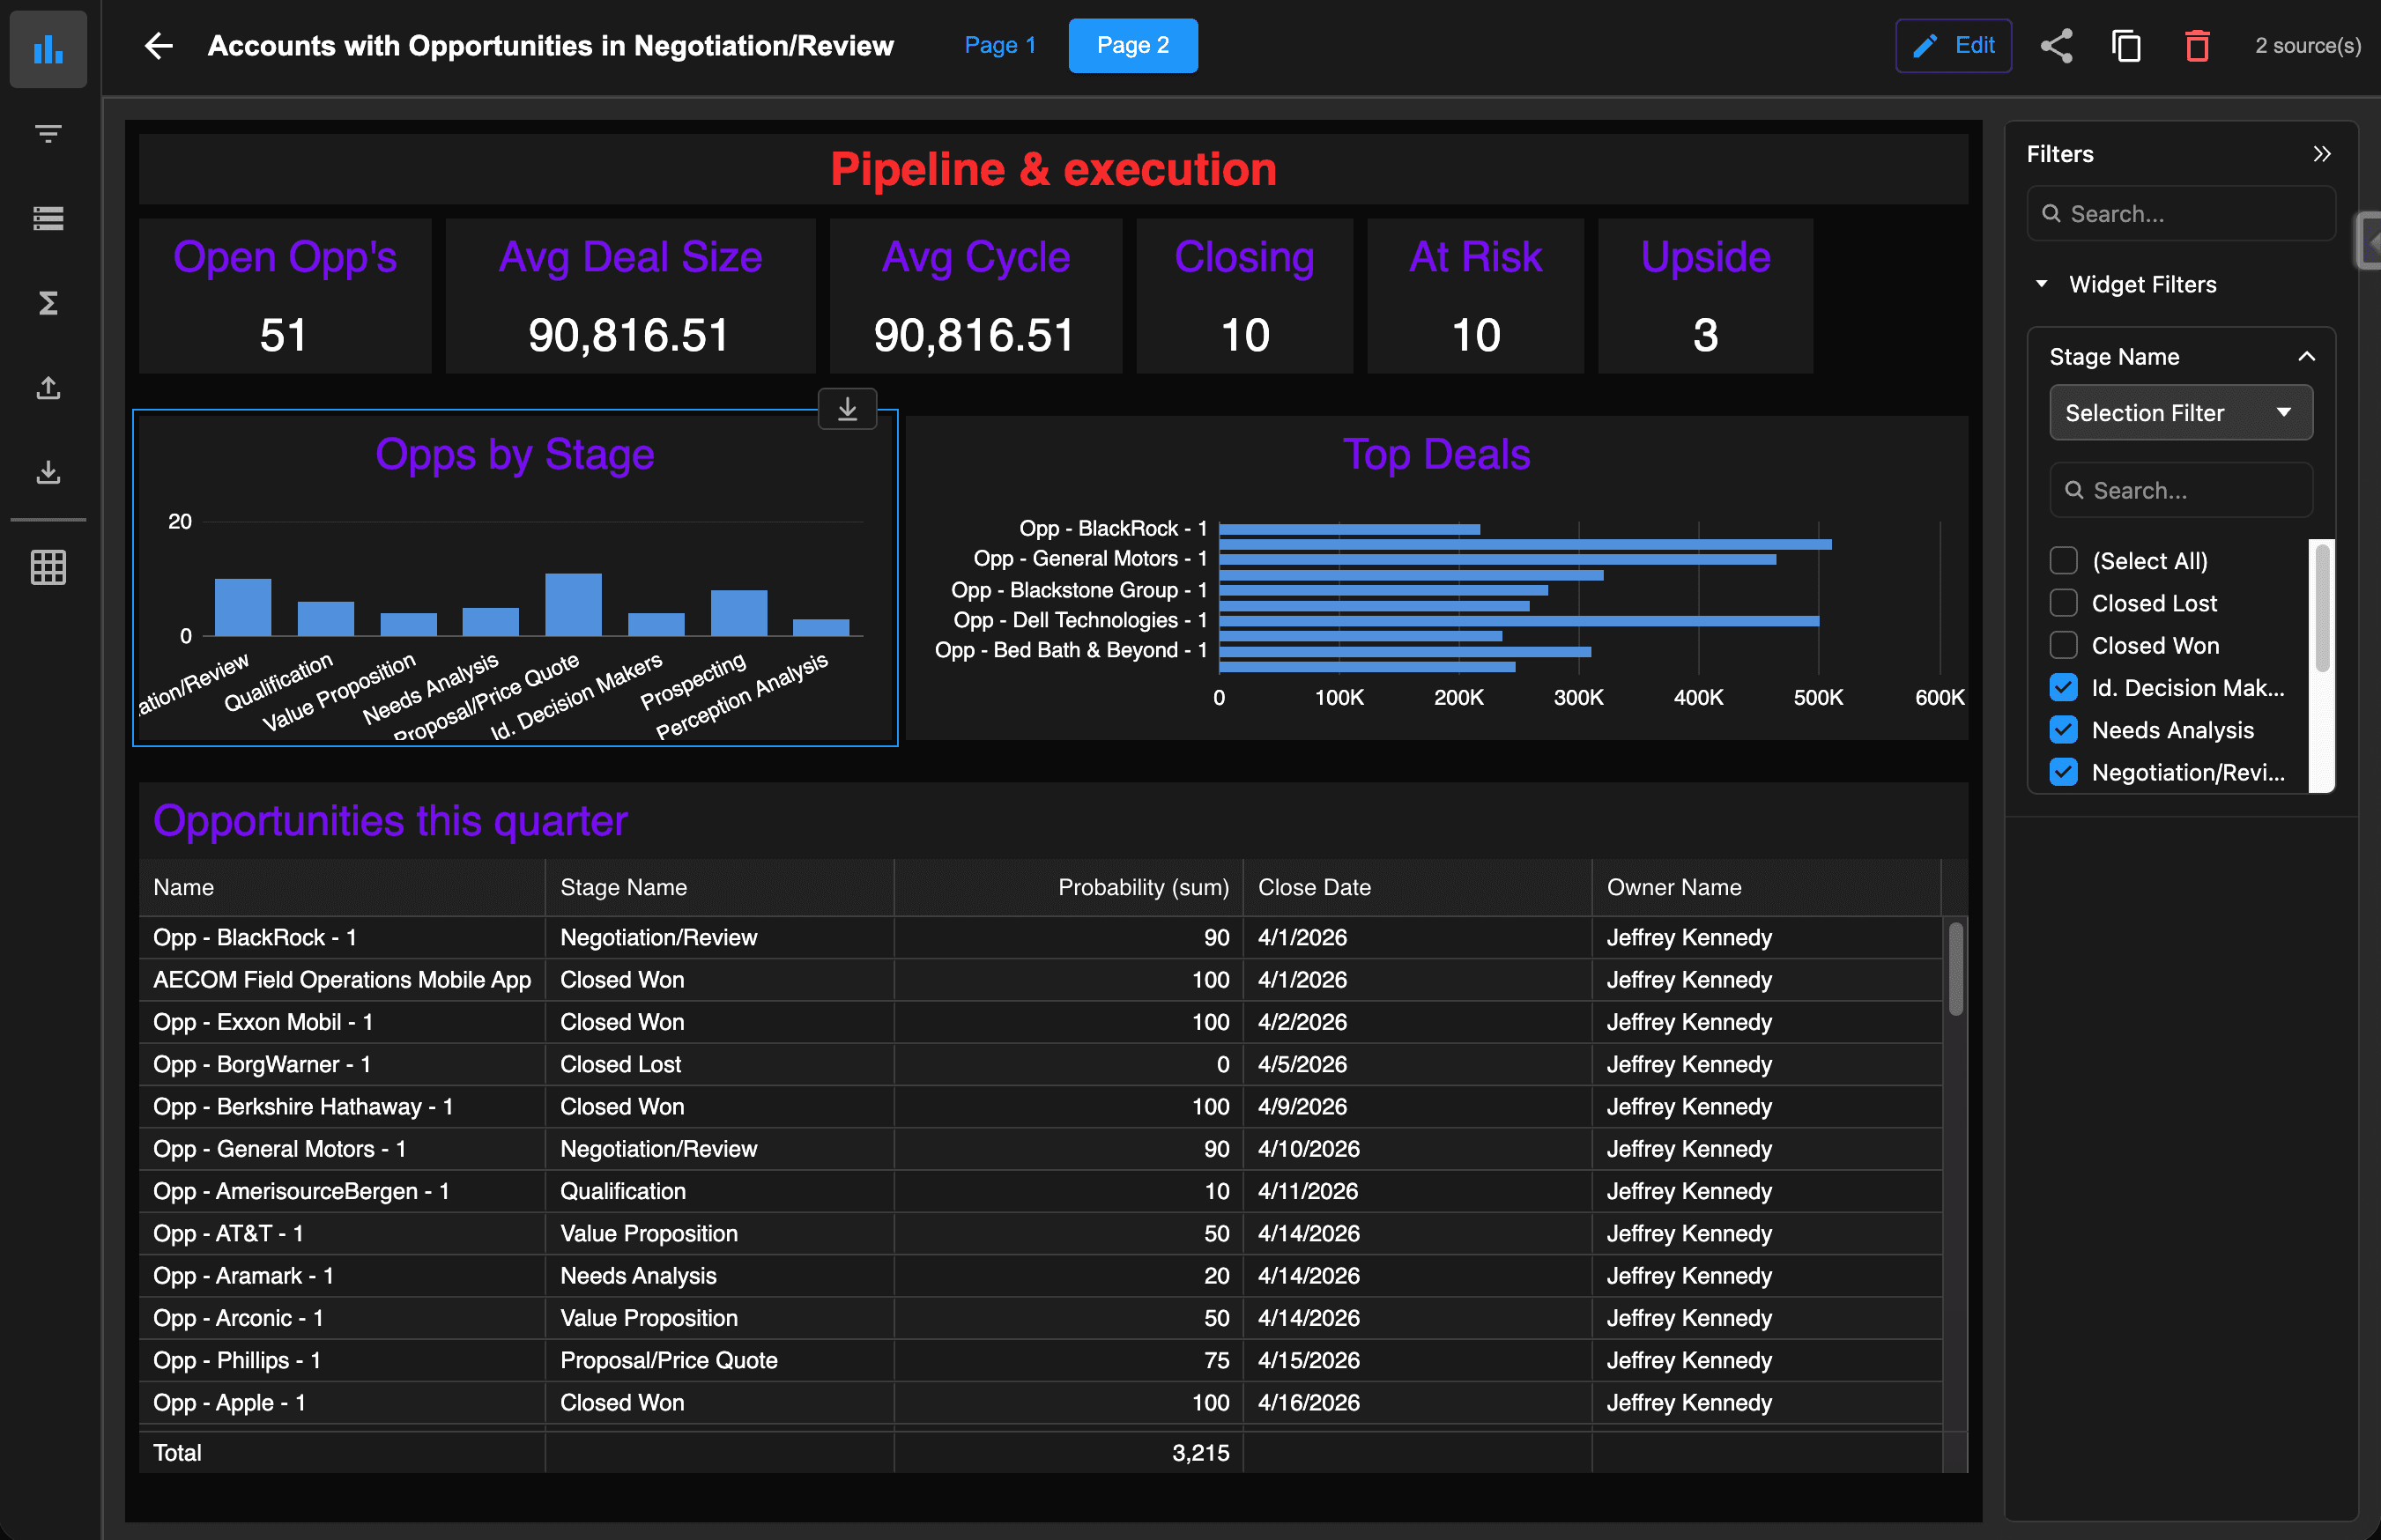
We also support multiple pages. Let's click on Page 2 which is displaying pipeline metrics.
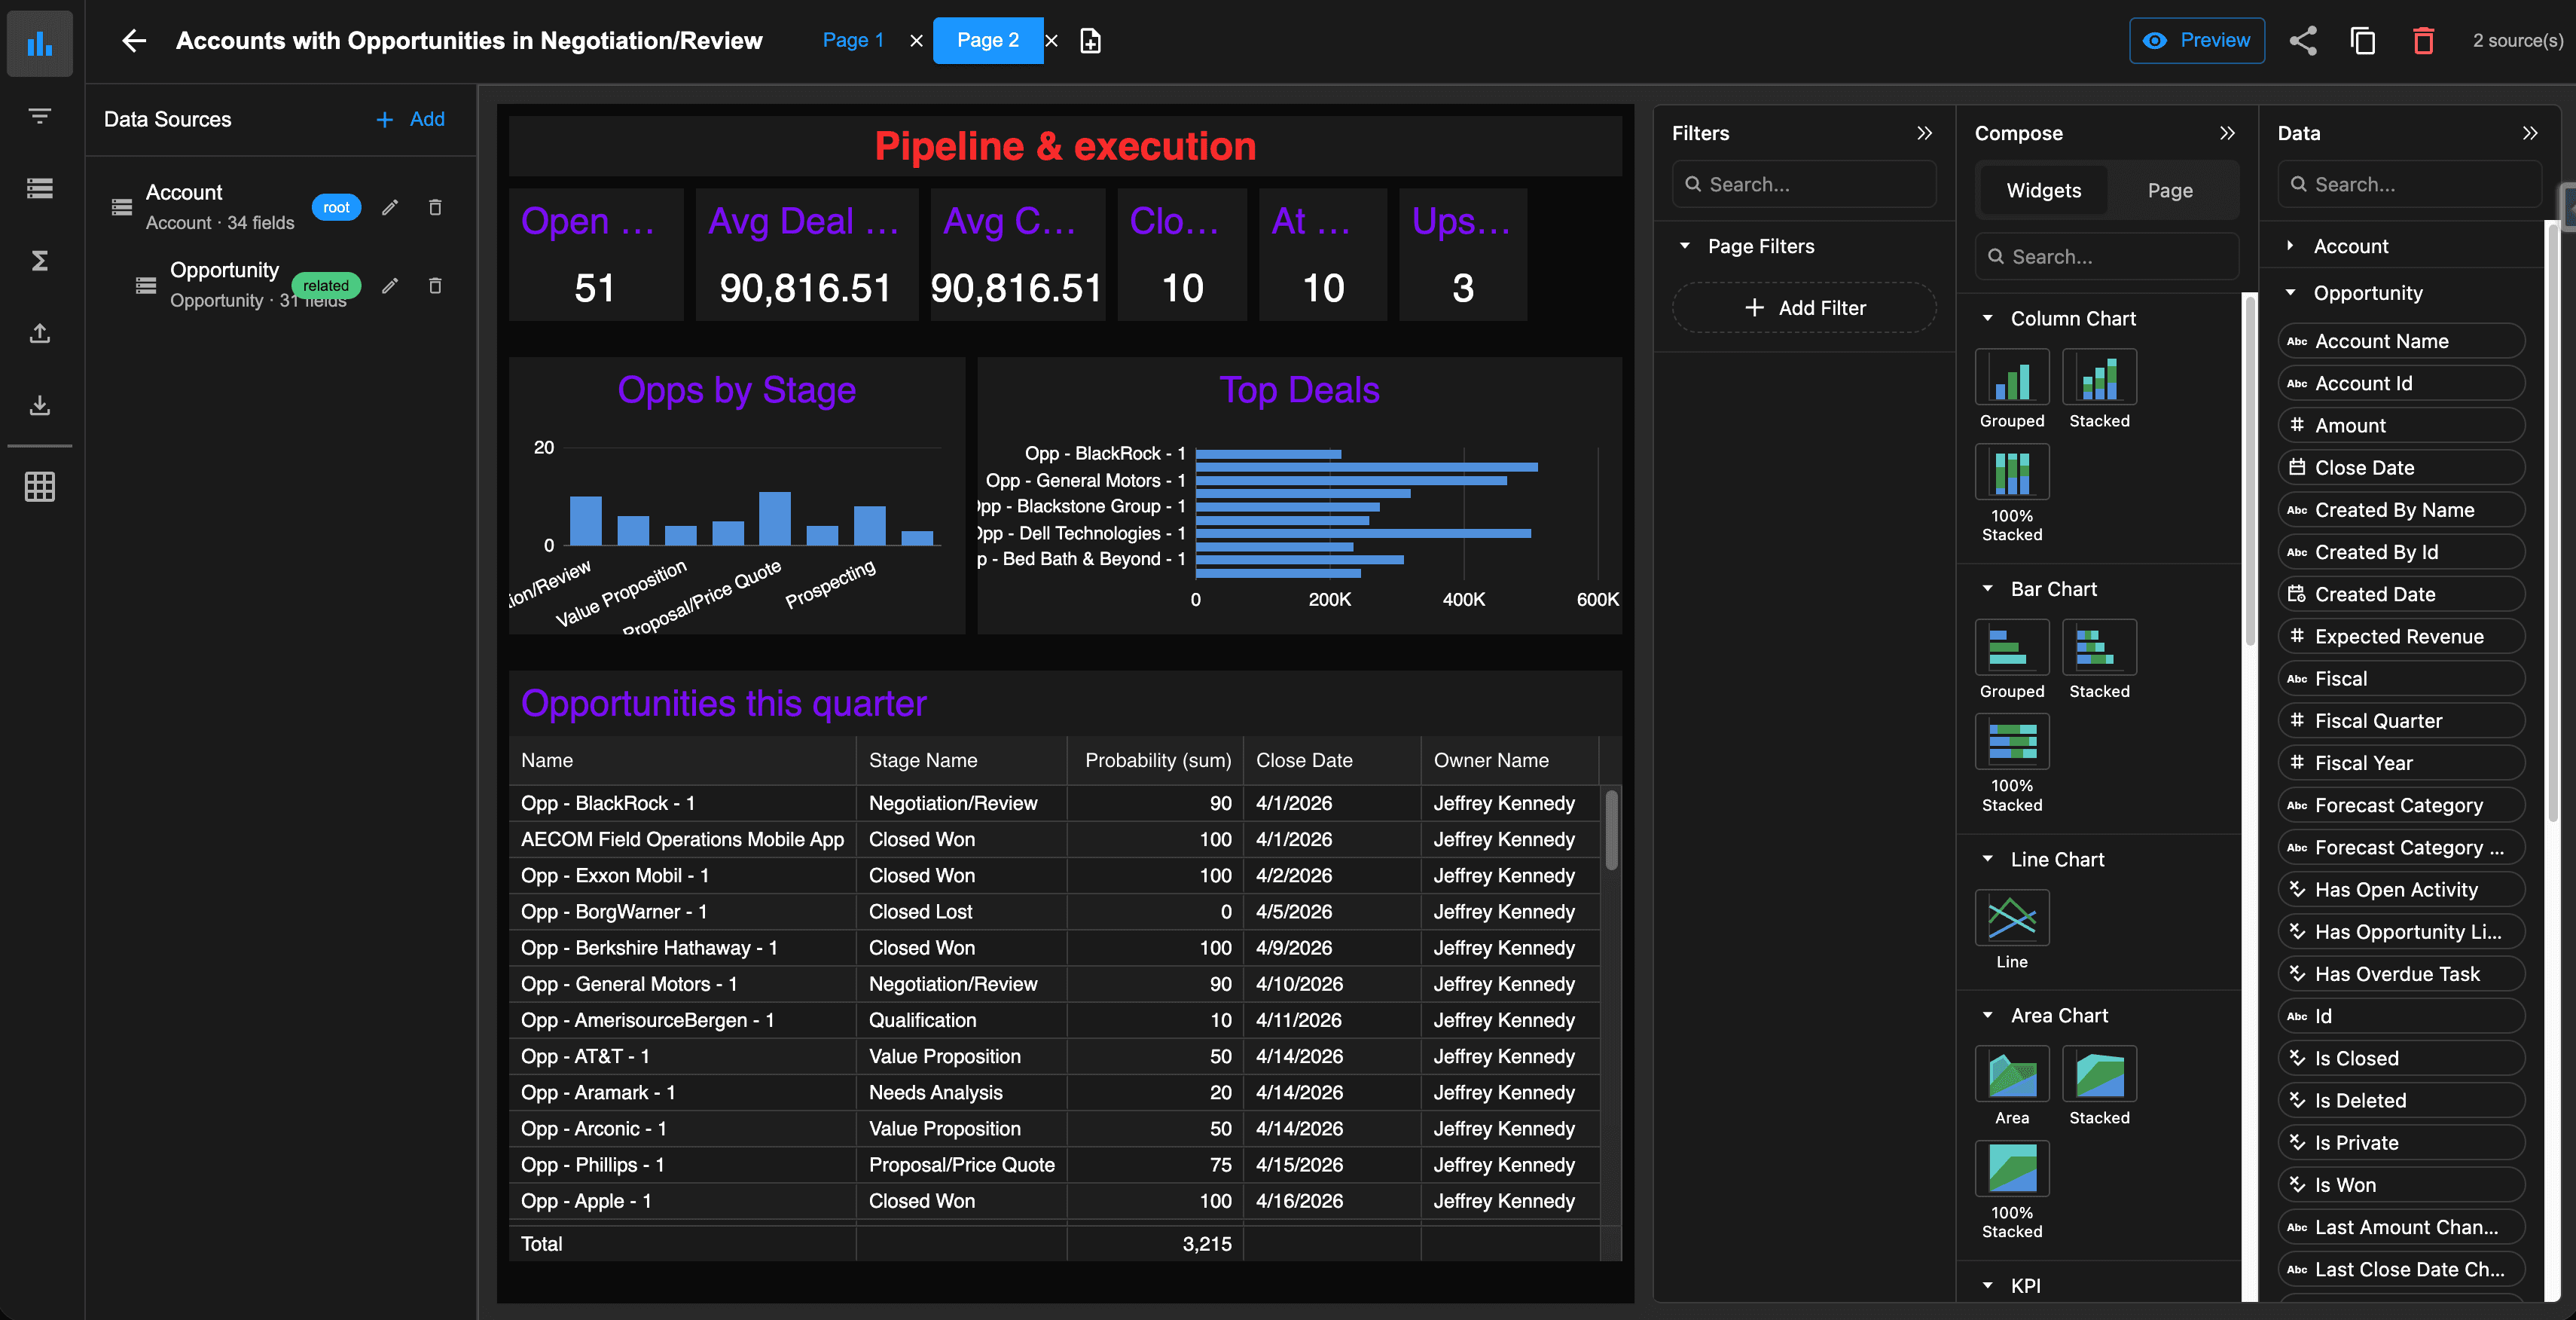
Let's click on the editor to see now easy it is to define our dashboard reports.
For more details on how to create dashboards, please watch the video.